
In the 19th century, Darwin's theory of natural selection was boiled down to a single catchphrase. And this catchphrase was, well, very catchy. Today, 'survival of the fittest' is used by biologists and non-biologists alike to summarise the process of evolution. But what does it actually say?
We should start with a common misinterpretation. If we take the standard definitions of ‘survival’ and ‘fitness’ used in everyday language the phrase appears to state:
Individuals that can do the most exercise, live longer lives.
Unfortunately, Darwin did not intend for this phrase to be an advertising campaign for people to get off the couch. ‘Survival’ here refers to the survival of traits across multiple generations. Think of the trait for being born two hands. This has certainly survived for quite a while in humans, probably because picking up things is pretty useful.
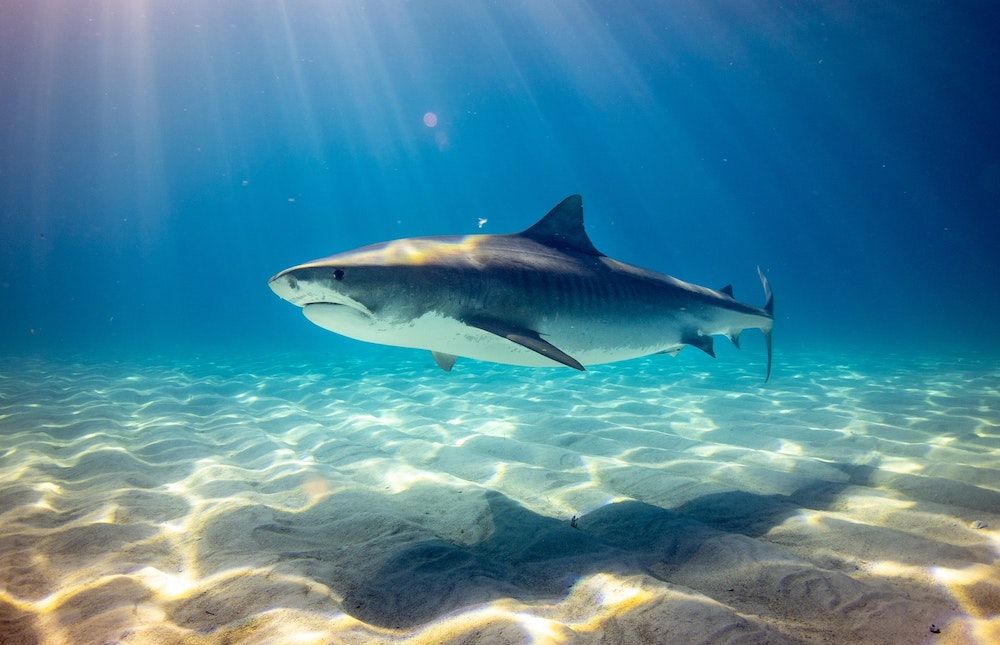
That brings us to ‘fittest.’ Rather than referring to exercise, Darwin used the word ‘fit’ more in the sense of a political candidate being fit (or suitable) for office. In a biological sense, an organism that is fit is one that is very well adapted to their environment. Take the streamlined body of a shark which allows it to swim faster through water.
With these clarified definitions, ‘survival of the fittest’ provides a nice summary of Darwin’s theory. Individuals that are better adapted to their environment (the fittest ones) are naturally selected. They survive long enough to reproduce, passing on their genes to the next generation. This causes the trait to be maintained in the species. So we have Darwin’s original interpretation of the phrase:
Traits that cause individuals to be the best adapted to their environments, survive in a species over many generations.
When interpreted like this, ‘survival of the fittest’ really is useful. It is perhaps why it has prevailed for over a hundred years. The problem is that the ‘fittest’ individuals can also be interpreted subjectively.
In the 1870s some considered the fittest individuals to be those that were the strongest, meanest, most muscular and whitest. Obviously, these characteristics were arbitrarily chosen. This was a disastrous application of ‘survival of the fittest,’ known as social Darwinism. Such ideas were used as justification for genocide, eugenics, racism and a whole host of other horrible ideas.
Thankfully, social Darwinism has been rightfully deemed pseudoscientific and largely abolished. So this dangerous interpretation is:
Individuals that are the most like an arbitrary conception of an ideal human (strong white European male) will survive. Everyone else will not. [Oh dear]
By the 1930s, fitness had begun to take on a more rigorous meaning. This period was known in biology as the modern synthesis. It was when biologists first realised that Gregor Mendel’s theory of genetics and Darwin’s theory of evolution could work hand in hand.
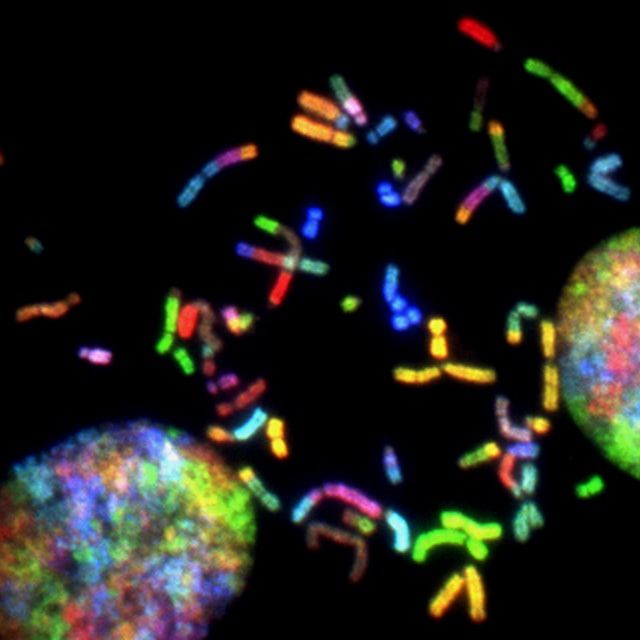
Before the modern synthesis, these were actually competing schools of thought. Mendelians favoured the laws of genetics to explain biological variation whilst Darwinians favoured the theory of natural selection. Today this distinction seems bizarre because the two have become so intertwined. Even people with no biology backgrounds will understand the concept of “passing on genes.” But this idea is a pure result of the modern synthesis.
As the synthesis was progressing, many evolutionary models were created using genetics as a basis. This often resulted in some very, very scary equations:
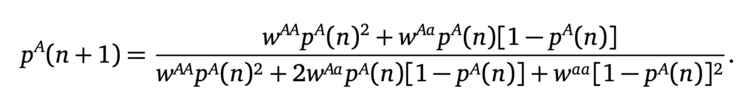
But in these huge equations, fitness is interpreted simply as the number of offspring that an individual produces. Also for some really silly reason, w became the letter we use to represent fitness. Don’t ask me why, if someone does then please let me know.
This can be seen as a proxy for true adaptation. Since individuals that are better adapted to their environments are also the ones that more likely to reproduce. Those that are more poorly adapted on the other hand, are less likely to reproduce.
In some environments, maybe the smartest individuals are the ones that manage to reproduce the most. In others, it might be the strongest. So this interpretation provides a nice catchall for describing adaptation in a meaningful way. More importantly, it captures the idea of natural selection from the gene’s perspective.
For instance, imagine a kangaroo that was an incredible boxer. He might be able to fight off any contenders that dare to fight him. But at the end of the end of the day, he is pretty wounded and is way to exhausted to socialise with any lady kangaroos. If you get my drift. He might die quite young because of his tough lifestyle.
This kangaroo is very well adapted to his environment. But from the gene’s perspective, his genes are not very good at all as they are not allowing him to reproduce any offspring. So actually, this strategy is not fantastic under the eyes of natural selection.
Thus, the modern synthesis taught us that it is not just adaptation that matters. It is reproduction that is important. Biology is all about sex. This leaves us with the genetical interpretation of ‘survival of the fittest’:
Traits that cause individuals to reproduce the most, survive in a species over many generations.
If this is the proper interpretation of the phrase, then how do we sort it out from all of the others? One solution would be to ditch ‘survival of the fittest’ in favour of the full sentence above. This is fine, but it leaves the mathematician inside of me wanting more. How can we quantify this?
The Price equation
We can start with the first half of the sentence and go from there. Which means we need to answer the question:
Does a particular trait cause individuals to reproduce more?
Let’s investigate this in sharks, where our trait of interest is body length. To do this, we need to collect two pieces of data from each of the sharks in our imaginary population:
- Their body lengths;
- The number of baby sharks that each parent shark produces during their lifetime.
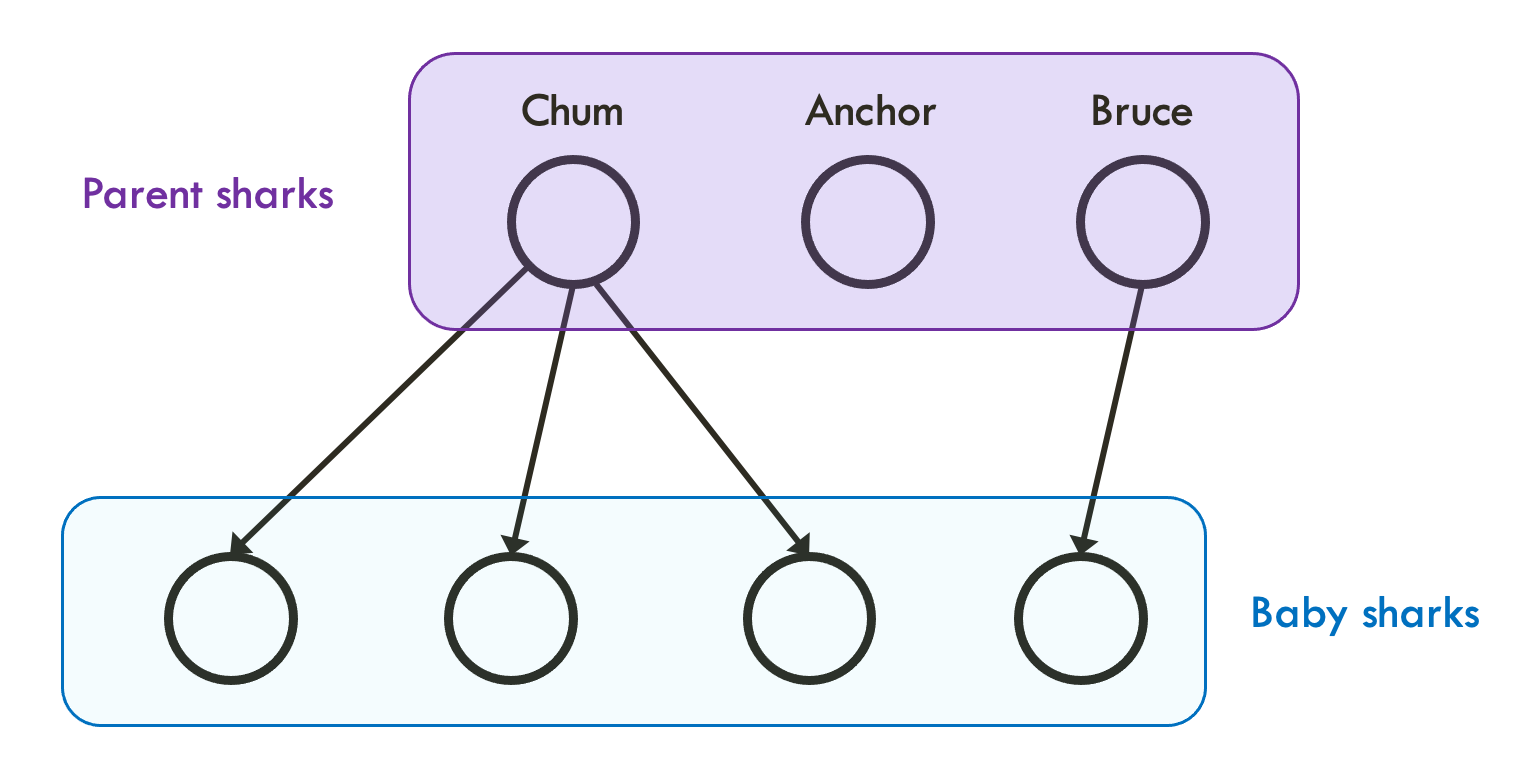
In practice, I can’t imagine doing a shark census like this would be easy, but let’s roll with it. Imagine we get the following table (I’ve just put in the first three to keep things simple):
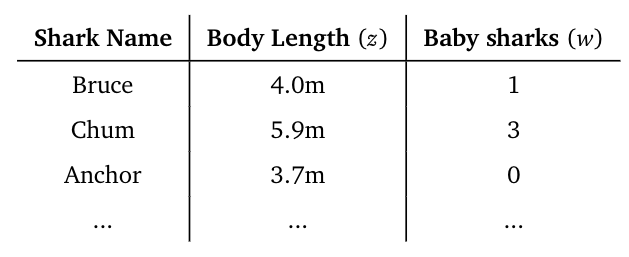
This is a little hard to interpret. But we can quite easily plot all of this information on a graph to see exactly what’s going on here:
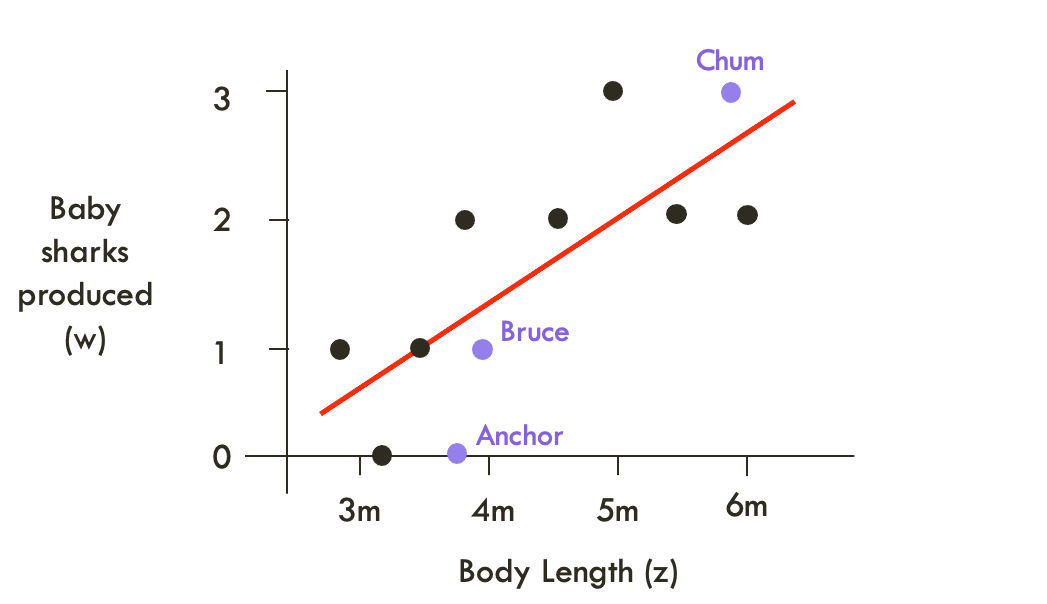
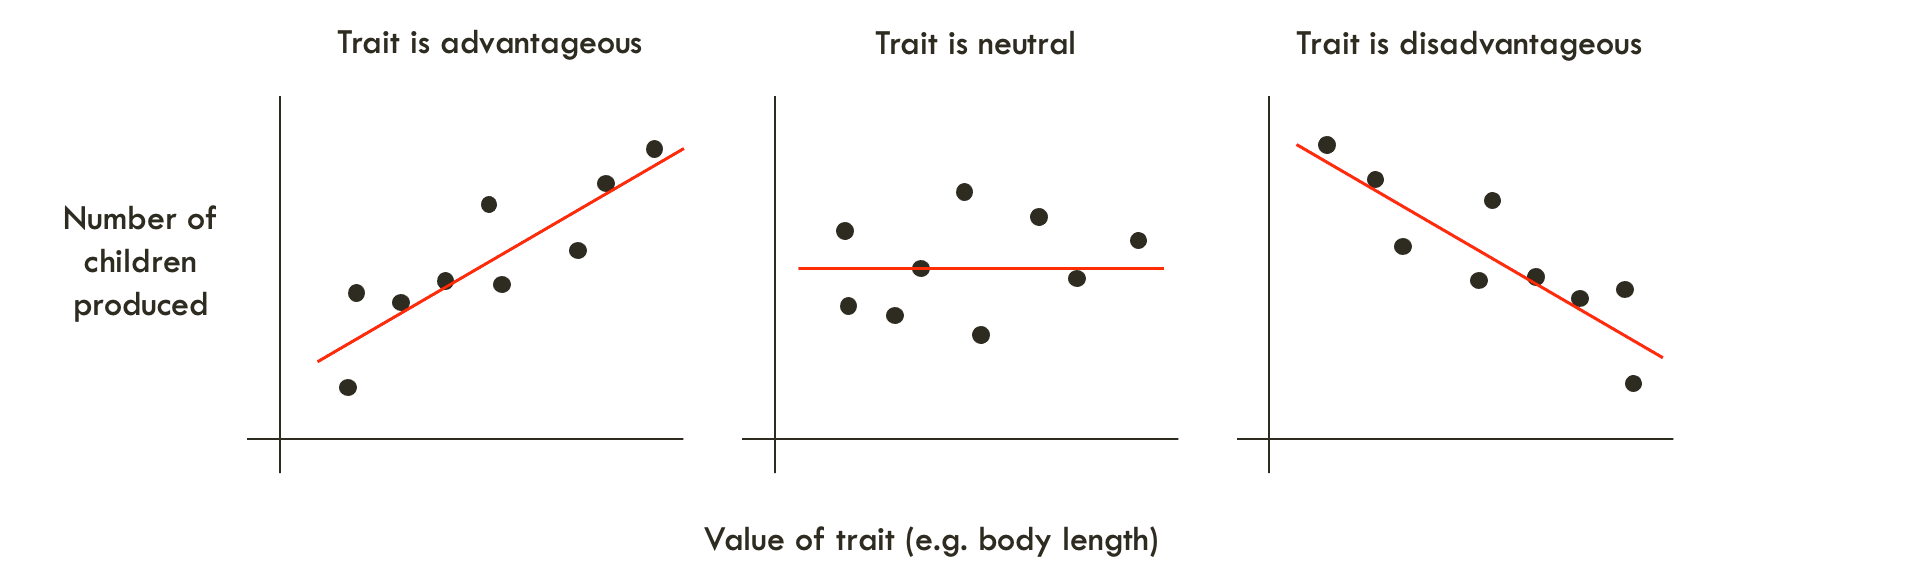
Notice the red trendline. Since it is upward sloping, it means that longer sharks are more likely to reproduce. Body length is a favourable trait. Sharks that are longer are fitter. So by analysing the slope of this red line, we can determine whether a trait is associated with higher reproductive capacity, answering our question. Mathematically, this slope is called the covariance and is written like Cov(w, z). There are a couple of points to note here.
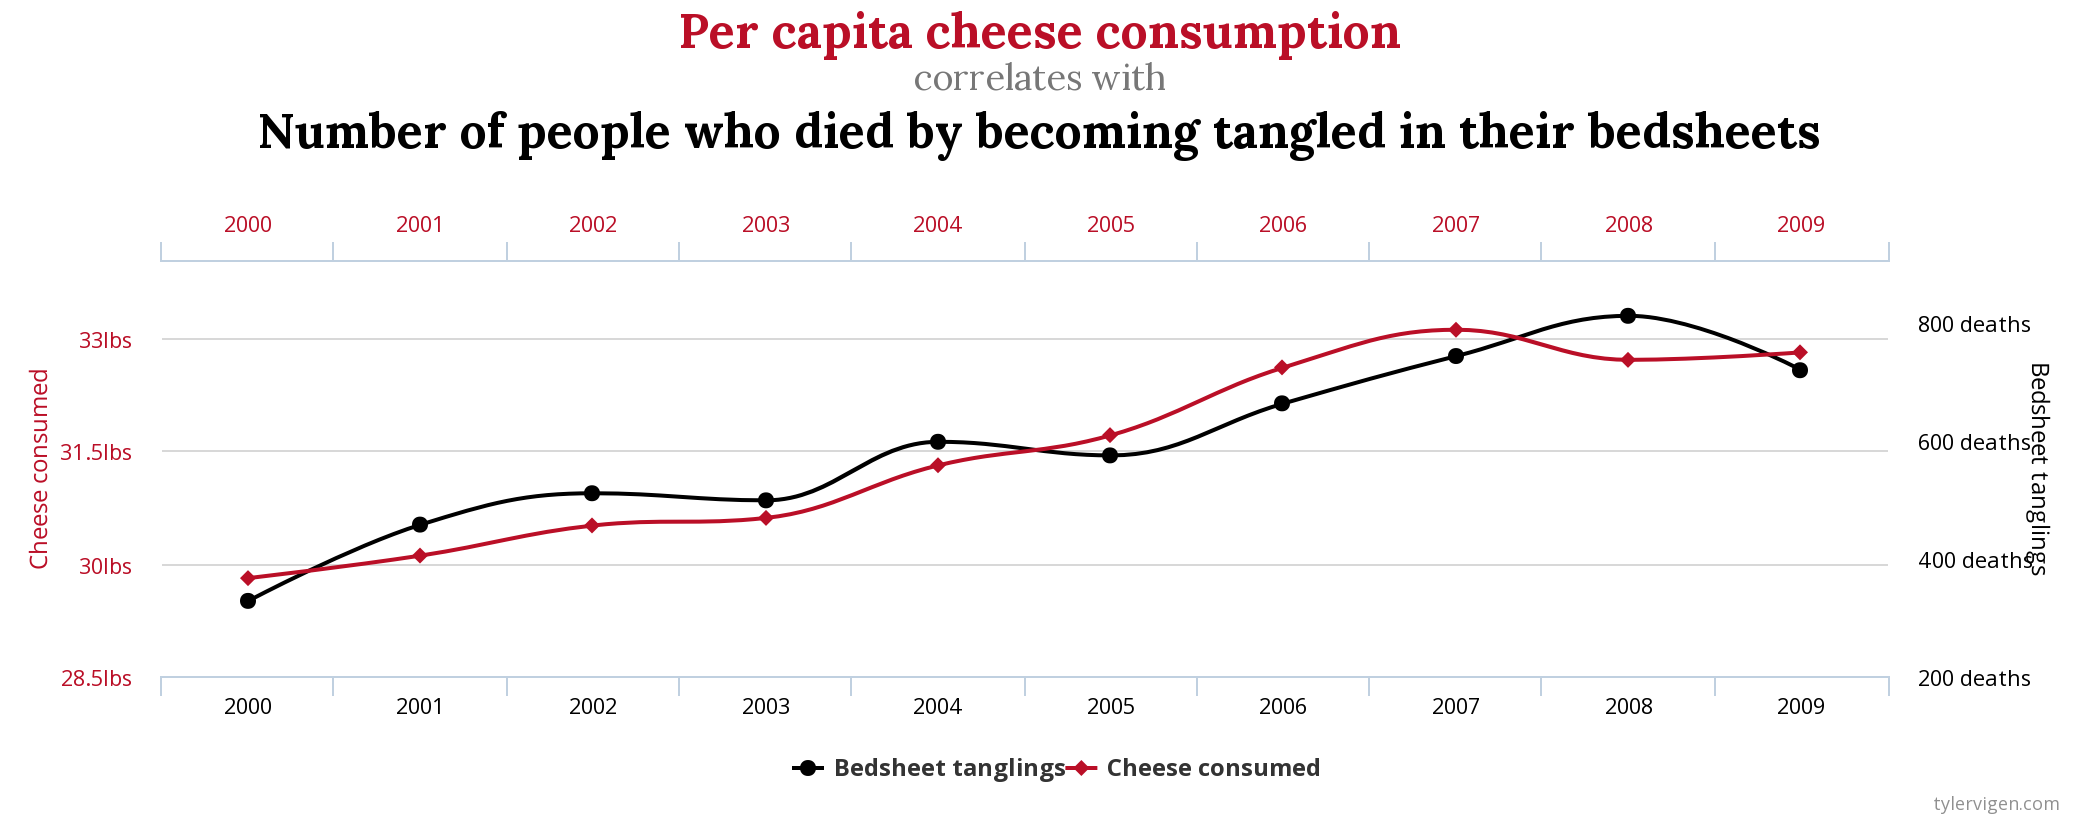
First, is the standard warning that correlation does not equal causation. A covariance is a mere statistical association, not a causal one.
Second, is that the slope of this line is not quite the covariance, but for our discussion, it’s close enough. Sorry statisticians.
Third, we don’t actually care about how many babies an individual shark produces. We only need to know how much a shark reproduces compared to everyone else. This will allow us to study frequencies of the trait, rather than the individual lengths of every shark. We can fix this by simply dividing the covariance above by average fitness, w̅. In maths speak, this turns our measure of fitness into a relative metric.
Ok, moving onwards, we can now focus on the second half of the genetical interpretation of ‘survival of the fittest.’ We need to answer the question:
Has a trait survived in a particular species over multiple generations?
One way to do this is measure how the average value of a trait, z̄, changes between generations. For our sharks, we have two generations with the following data:
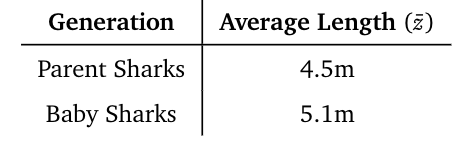
In this case, the average length of sharks has increased in the second generation. So the trait has ‘survived.’ The key value of interest here is the change in average length between the two generations: Δz̄ = +0.6m.
It just so happens that we can actually now stick these two pieces together to form the Price equation:
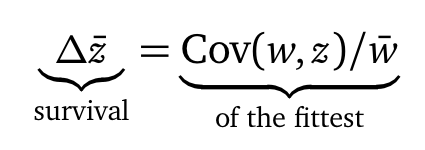
This is the basis of what I have been studying for the past six months of my life. In essence, it really is just a mathematical summary of ‘survival of the fittest’ — in the genetical interpretation I have given above. It was discovered in 1970 by geneticist George Price, who was actually a trained chemist. Some of his further work, based upon this equation drove him so mad that he ended up killing himself. But that is certainly a story for another day.
On a more positive note, we have successfully transformed the ambiguity of the phrase ‘survival of the fittest’ into a clear mathematical equation. This representation of natural selection has also proven to be extremely useful. It provides the basis for a number of super important theorems of evolution. The Price equation itself has been suggested as a ‘fundamental theorem of evolution.’
How fitting then, that at its core is the motto for Darwin’s theory of natural selection itself.
Jake

Member discussion: